Contents 17 sections
- What Is Inventory Planning?
- Why Is Inventory Planning So Important in E-Commerce?
- What Are the Core Concepts of Inventory Planning?
- Step 1: How to Calculate Average Daily Sales
- Step 2: How to Determine Lead Time
- Step 3: How to Calculate Safety Stock
- Step 4: How to Calculate the Reorder Point
- Reorder Point and Safety Stock Tool
- How Much Should You Order? Economic Order Quantity
- How Much Attention Should Each Product Get with ABC Analysis?
- What Is Inventory Turnover and How Is It Calculated?
- How to Plan Inventory for Seasons and Campaign Periods
- How to Manage Inventory Across Multiple Sales Channels
- 8 Common Mistakes in Inventory Planning
- Inventory Planning Checklist
- Making Inventory Planning Data-Driven with Faprika
- Frequently Asked Questions
In e-commerce, inventory hurts you in two ways: too little and you lose sales, too much and your money sits on the shelf. On the day your best-selling product runs out, you lose both the customer and the advertising budget; stock tied up in a product that never sells clogs your cash flow. Safety stock and the reorder point are the calculations that strike a balance between these two extremes, and they are the numerical answer to "when and how much should I order?"
This article is structured like a lesson. Through examples and formulas, you will learn the core concepts of inventory planning, how to calculate daily sales and lead time, how to find safety stock with two methods, and how to work out the reorder point, order quantity, ABC analysis and inventory turnover. With the two tools in the article, you can enter your own numbers and see the result right away.
What Is Inventory Planning?
Inventory planning means deciding how much stock to hold of each product, and when and how much to order, based on past sales data and lead time. The goal is to make sure the new order arrives before stock runs out, without tying up more stock than necessary.
Inventory tracking answers the question "what do I have?"; inventory planning answers "when should I reorder?" The two complement each other: you cannot plan without tracking, and without planning, tracking is just a list of numbers.
We recommend readingWhat Is Stock Tracking? How Is It Done?Why Is Inventory Planning So Important in E-Commerce?
A wrong inventory level means both lost sales and tied-up cash; both affect your profit directly. When stock runs out, a customer you brought in with advertising lands on an empty page, and on marketplaces, orders cancelled due to insufficient stock can negatively affect store performance.
- Cost of stockouts: Lost sales, wasted ad spend, lost customers and rushed (expensive) replenishment.
- Cost of overstock: Tied-up cash, warehouse and handling costs, aging or out-of-season products, and stock that has to be cleared with discounts.
- Cash flow: Inventory is one of a business's largest cash investments; proper planning frees up that money.
- Customer experience: A store that is always in stock inspires trust and brings customers back.
What Are the Core Concepts of Inventory Planning?
Inventory planning rests on six concepts: average daily sales, lead time, safety stock, reorder point, order quantity and inventory turnover. They are all linked, and the formulas establish the relationship between them.
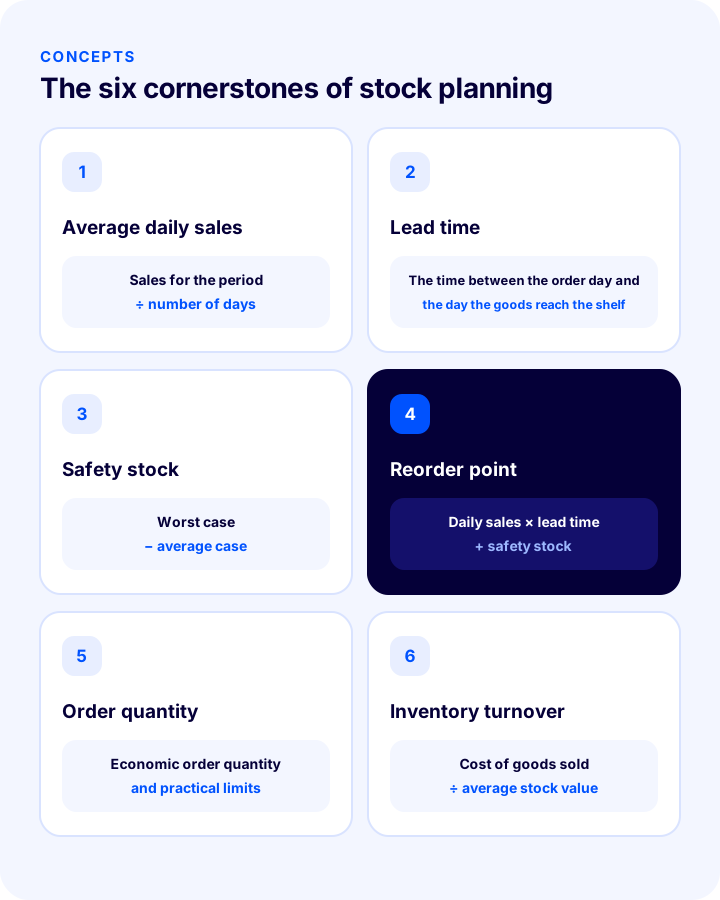
| Concept | Meaning | Formula or source |
|---|---|---|
| Average daily sales | How many units of a product are sold per day on average | Period sales ÷ number of days |
| Lead time | The time from the day you place an order to the day the product reaches your shelf | Average and longest of past orders |
| Safety stock | Extra stock held so you do not run out when demand or supply turns out worse than expected | Below, with two methods |
| Reorder point | A new order is placed when stock falls to this level | Daily sales × lead time + safety stock |
| Order quantity | How many units to order each time | Economic order quantity and practical limits |
| Inventory turnover | How many times stock is sold and replenished in a given period | Cost of goods sold ÷ average inventory value |
Step 1: How to Calculate Average Daily Sales
Average daily sales is found by dividing the total units sold in a given period by the number of days; however, choosing the period and unusual days correctly determines the result. The last thirty to ninety days is usually a good starting point.
- Choose the period: The last 30, 60 or 90 days; take a short period if the product sells fast and a longer one if it sells slowly.
- Find the units sold in that period: Get the sales quantity per product or variant from the order report.
- Remove out-of-stock days: Days when the product was not in stock make sales look lower than they are; leave these days out of the calculation.
- Treat campaign and unusual days separately: Sales on discount days inflate the average of normal days; plan for campaigns separately.
- Determine the divisor: Total units ÷ (number of days in the period − number of out-of-stock days).
Example (illustrative): 720 units were sold in the last 60 days and the product was out of stock for 6 days. Average daily sales = 720 ÷ (60 − 6) = 13.3 units. If you had not subtracted the out-of-stock days, you would get 12 units; in other words, you would underestimate demand.
Step 2: How to Determine Lead Time
Lead time is the total period from the day you place an order to the day the product reaches your shelf, ready for sale; it covers production, transport, goods receipt and system entry. Use the actual time, not just the time your supplier quotes.
- Review the last few orders: Write down the difference between the order date and the goods receipt date.
- Note the average and the longest time separately: Safety stock is based on the difference between these two values.
- Add goods receipt and system entry time: Even when the product arrives at the warehouse, it can take days to be made available for sale.
- Know the seasonal delays: Lead time can lengthen during holidays, the start of the season and campaign periods.
Step 3: How to Calculate Safety Stock
Safety stock is the extra stock held so you do not run out when demand is higher than expected or supply takes longer than expected. The simplest method compares the worst case with the average case; the advanced method accounts for demand variability statistically.
Simple method: worst case minus average case
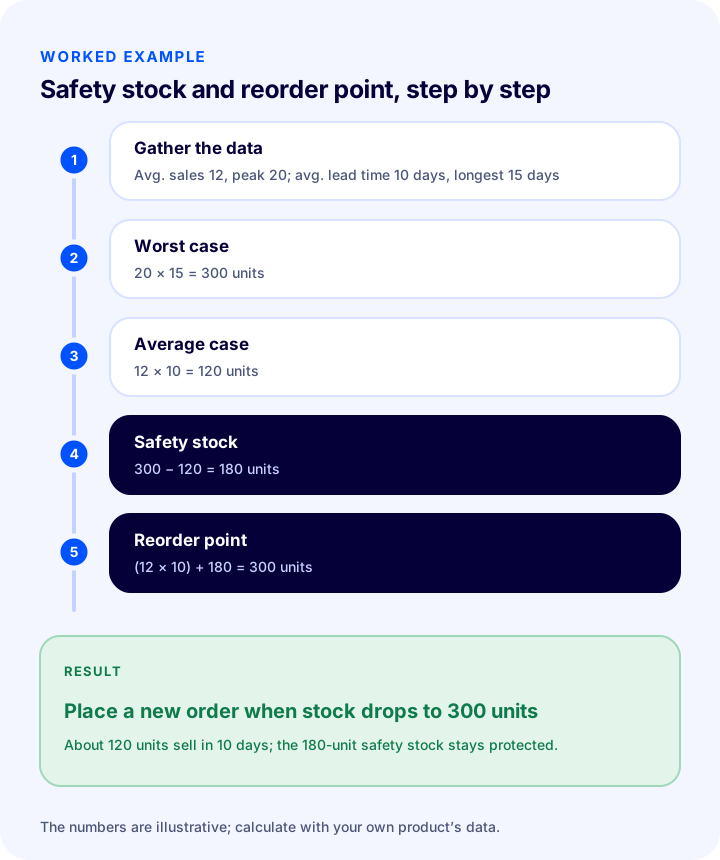
Formula: Safety stock = (peak daily sales × longest lead time) − (average daily sales × average lead time). This method is easy and cautious; it assumes that the two worst cases will occur at the same time.
Example (illustrative): Average daily sales are 12 units and peak daily sales are 20 units; average lead time is 10 days and longest lead time is 15 days. Safety stock = (20 × 15) − (12 × 10) = 300 − 120 = 180 units.
Statistical method: based on service level
Formula: Safety stock = Z × standard deviation of daily demand × √lead time (days). The Z value corresponds to the service level you want (the probability of not running out of stock).
| Service level | Z value | Meaning |
|---|---|---|
| %90 | 1,28 | Risk of running out of stock in about 1 of every 10 order cycles |
| %95 | 1,65 | Risk in about 1 of every 20 cycles |
| %99 | 2,33 | Risk in about 1 of every 100 cycles |
Example (illustrative): The standard deviation of daily demand is 4 units, lead time is 10 days and the target service level is 95%. Safety stock = 1.65 × 4 × √10 = 1.65 × 4 × 3.16 ≈ 21 units. This is much lower than the 180 units of the simple method, because the statistical method does not assume that the two worst cases will occur together.
Step 4: How to Calculate the Reorder Point
The reorder point is the stock level at which a new order must be placed. Formula: Reorder point = average daily sales × average lead time + safety stock. If you place an order when stock reaches this point, the quantity sold until the product arrives is covered by normal demand, while the safety stock is reserved for surprises.
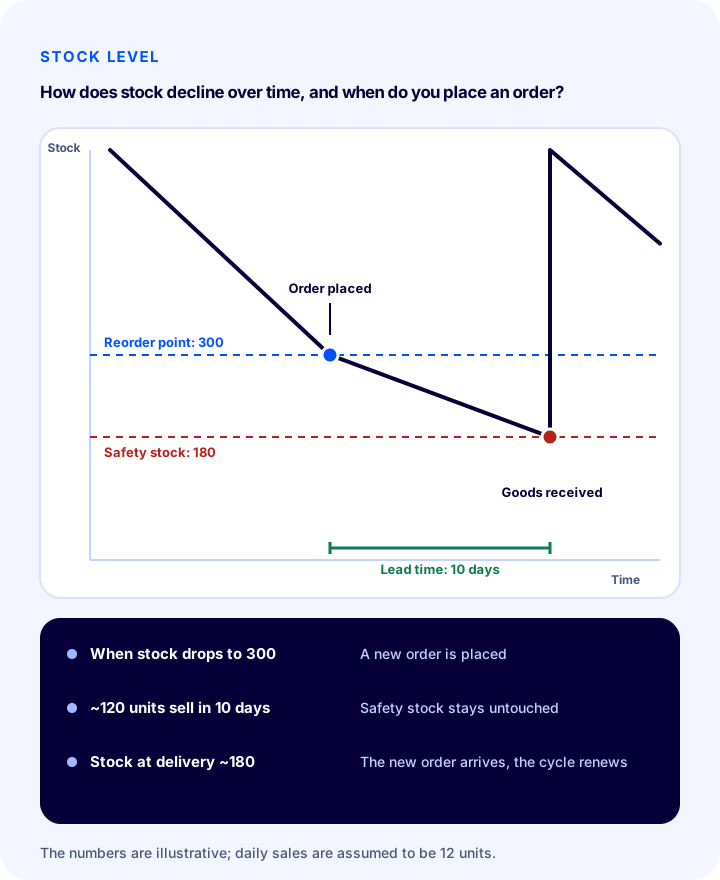
With the same example (illustrative): If average daily sales are 12 units, average lead time is 10 days and safety stock is 180 units, the reorder point = (12 × 10) + 180 = 300 units. You place the order when stock falls to 300; by the time the product arrives in 10 days, about 120 units will have been sold and 180 units remain as safety stock.
Reorder Point and Safety Stock Tool
The tool below calculates safety stock (simple method) and the reorder point from your daily sales and lead time figures, compares them with current stock and tells you what to do. Replace the numbers with your own product's data.
The tool uses the simple method and gives a cautious result; for best-selling products, compare it with the statistical method. Calculate for a single product or variant: since sizes and colors sell at different speeds, each variant should have its own reorder point.
How Much Should You Order? Economic Order Quantity
The order quantity is determined by the balance between the cost of ordering too often and the cost of holding too much stock. The economic order quantity (EOQ) formula calculates this balance: EOQ = √(2 × annual demand × cost per order ÷ annual holding cost per unit).
Example (illustrative): If annual demand is 4,380 units, the fixed cost per order (shipping, handling) is ₺300 and the annual holding cost per unit (tied-up cash, warehouse, risk) is ₺15, then EOQ = √(2 × 4,380 × 300 ÷ 15) = √175,200 ≈ 419 units. In other words, ordering about 419 units each time minimizes total cost.
- The formula is a starting point: The supplier's minimum order quantity, carton or pallet multiples and your cash position change the result.
- If demand is not constant, plan for the short term: For seasonal products the annual average is misleading; do a separate calculation for the season.
- Compare bulk-purchase discounts against the cost: Buying more to get a discount is worthwhile if it does not exceed the holding cost.
- Keep your cash position in mind: The best quantity is not one you have no cash to pay for.
How Much Attention Should Each Product Get with ABC Analysis?
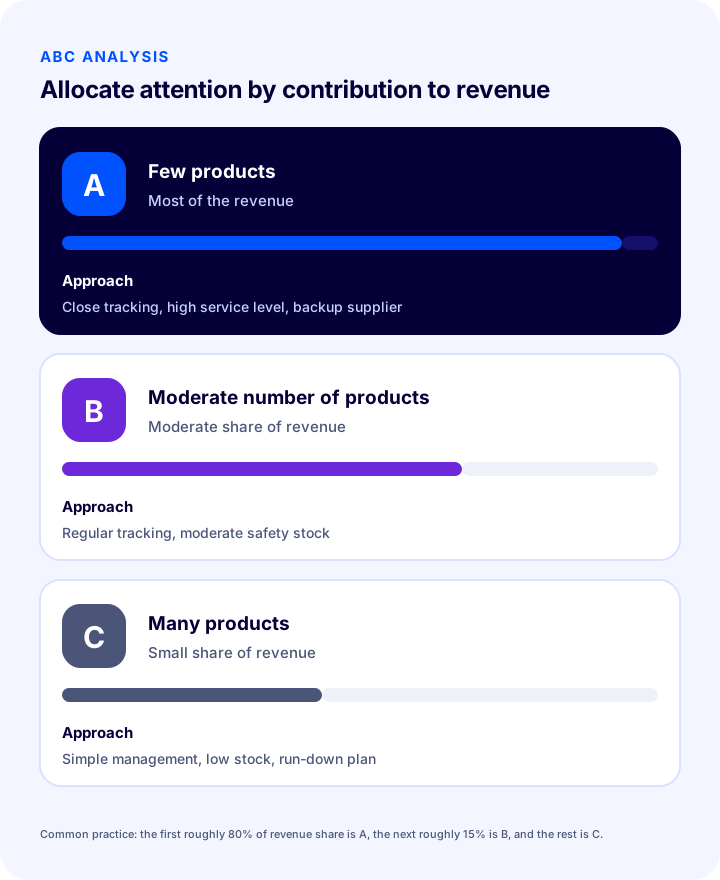
ABC analysis is a method that divides products into three groups according to their contribution to revenue and concentrates inventory attention on the products that create the most value. It is based on the Pareto principle: a small share of products brings in most of the revenue.
- Rank products by revenue: Take the total revenue per product for your chosen period and sort from largest to smallest.
- Calculate the cumulative share: Add up each product's share of revenue as you go.
- Split into classes: In common practice, the products that make up the first roughly 80% of revenue are classed as A, the next roughly 15% as B and the rest as C; you can adjust the thresholds to your business.
- Apply a different approach to each class: As in the table below.
| Class | Feature | Inventory approach |
|---|---|---|
| A | Few products, most of the revenue | Frequent monitoring, high service level, sufficient safety stock, backup supplier |
| B | Moderate number of products, moderate revenue | Regular monitoring, moderate safety stock |
| C | Many products, low revenue | Lean management, low stock, ordering as needed; a clearance plan for slow sellers |
What Is Inventory Turnover and How Is It Calculated?
Inventory turnover shows how many times your stock is sold and replenished in a given period; a high turnover rate means cash sits on the shelf for less time. The formula: Inventory turnover = cost of goods sold in the period ÷ average inventory value. The average time in stock is found with 365 ÷ turnover rate.
Example (illustrative): if the annual cost of goods sold is ₺1,200,000 and the average inventory value is ₺300,000, the turnover rate is 4, and products sit on the shelf for about 365 ÷ 4 ≈ 91 days on average. Increasing turnover means making the same sales with less stock, or selling more with the same stock.
Calculate turnover for the store as a whole, and also separately for each category and product group: the overall average hides slow products waiting behind fast-moving ones. For products with very low turnover, consider a clearance campaign, smaller order quantities, or removing them from the catalog.
How to Plan Stock for Seasons and Campaign Periods
During campaigns and seasons, demand rises far above normal, so a plan based on the usual daily average sales falls short. For these periods you need a separate demand forecast, and you need to bring the supply lead time forward accordingly.
- Look at the same period last year: Check how much of each product was sold in the same campaign or season.
- Add growth or decline: If your traffic and ad budget are different this year, adjust the forecast accordingly.
- Count back the lead time: Subtract the supply lead time and the goods receipt time from the campaign date to find the order date.
- Add a safety margin for class A products: To avoid running out of the campaign's best sellers, round the forecast up by some amount.
- Plan an exit for the end of the season: Decide up front how you will clear products once the season is over.
How to Manage Stock Across Multiple Sales Channels
If you sell on marketplaces as well as your own site, stock is a shared pool for all channels; if a sale on one channel does not update the others, the same product gets sold twice. That is why stock planning should be done on total demand, not channel by channel.
- Combine demand: Calculate the daily average sales from the total of all channels.
- Sync stock automatically: A sale on one channel should update the stock on the other channels.
- Consider allocating a share to each channel: For best-selling products, you can set a per-channel cap to prevent one channel from consuming all the stock.
- Distinguish the speed of each channel: If a product sells a lot on a marketplace and little on your site, the combination of the two is the input for the plan.
8 Common Mistakes in Stock Planning
- Counting days with no stock: Sales look lower and demand is underestimated.
- Using the lead time the supplier quotes: The actual lead time is often longer.
- Holding no safety stock at all: A small delay means sales stop.
- Applying the same safety stock to every product: A products need a higher service level, C products a lower one.
- Not separating variants: Sizes and colors sell at different speeds; total stock is misleading.
- Making the plan once and never updating it: Sales speed and lead times change; calculations must be refreshed regularly.
- Mixing campaign demand with ordinary days: The average gets inflated, or the campaign is served with too little stock.
- Not monitoring slow-moving stock: Products with low turnover quietly tie up cash.
Stock Planning Checklist
When you set up and update your stock plan, you should be able to answer "yes" to all of the items below.
- Have you calculated the daily average sales for each product (and variant), excluding the days with no stock?
- Have you taken the average and the longest lead times from actual orders?
- Have you calculated the safety stock (using a simple or a statistical method)?
- Have you set the reorder point and set up a system that alerts you when stock drops to that level?
- Have you evaluated the order quantity together with the supplier's minimum quantity and your cash position?
- Have you separated A, B and C products using ABC analysis?
- Do you have a backup supplier for class A products?
- Do you calculate inventory turnover by product group?
- Do you forecast campaign and seasonal demand separately and count the lead time backwards?
- Is stock synchronized automatically across all sales channels?
- Do you refresh the calculations at least every three months?
Basing Stock Planning on Data with Faprika
Stock planning relies on reliable, up-to-date sales data; collecting that data by hand brings errors and delays. In the Faprika e-commerce infrastructure, the following elements are available for this stage (you can see which feature starts in which plan on the e-commerce plans page):
- Stock and sales reports: The product in/out movement report, product sales and remaining report, stock and variant report, variant fill report, and season and period report feed your daily sales and remaining stock calculation; reports vary by plan.
- Recording stock movements: Records why and when stock changed; varies by plan.
- Notify me when available: Customer demand for sold-out products is collected; this demand is a signal in the restocking decision. Varies by plan.
- Supplier and XML integration: You can import supplier stock into your site and create a backup source with no-stock selling; details are on the no-stock e-commerce page.
- Marketplace integrations: Your site and marketplaces are managed from a single panel; details are on the marketplace integration page.
- Warehouse management (WMS): Goods receipt by barcode, shelf placement, picking and counting, plus shelf stock reports; details are on the WMS Warehouse Management System page. Varies by plan.
Frequently Asked Questions
What is safety stock?
Safety stock is the extra inventory held to avoid running out when demand is higher than expected or supply takes longer than expected. It acts as a buffer against fluctuations in sales and lead time.
How is safety stock calculated?
In the simple method, safety stock is found by subtracting the product of average daily sales and average lead time from the product of peak daily sales and longest lead time. In the statistical method, the Z value is multiplied by the standard deviation of daily demand and the square root of the lead time.
What is the reorder point and how is it calculated?
The reorder point is the stock level at which a new order must be placed. It is calculated by multiplying average daily sales by average lead time and adding safety stock. For example, with 12 units sold per day, a 10-day lead time and 180 units of safety stock, the reorder point is 300 units.
What is lead time?
Lead time is the period from the day you place an order to the day the product reaches your shelf, ready for sale. It covers production, transport, goods receipt and system entry; use the actual time, not the one your supplier quotes.
What is ABC analysis?
ABC analysis is a method that divides products into groups A, B and C according to their contribution to revenue. Group A brings in most of the revenue with few products and is monitored closely; group C consists of many slow sellers and is managed simply. Inventory attention is concentrated on the products that create the most value.
How is inventory turnover calculated?
The cost of goods sold in the period is divided by the average inventory value. The result shows how many times the stock was sold and replenished in that period. For the average days in stock, divide 365 by the turnover rate; for example, if turnover is 4, products stay on the shelf for about 91 days on average.