
Contents 12 sections
- What Are E-Commerce Reports?
- Why Are E-Commerce Reports Important?
- Which Reports Are in the Faprika Panel?
- Which Question Are You Asking Before Opening the Report?
- How Do You Compare Periods?
- How Do You Read Sales and Order Reports?
- How Do You Set Up a Weekly Report Routine?
- From Report to Decision: Which Action Does an Observation Turn Into?
- The Most Common Mistakes When Reading E-Commerce Reports
- Weekly Report Checklist
- How Do You Use E-Commerce Reports with Faprika?
- Frequently Asked Questions
There are dozens of reports in the panel, you open a few every morning and look at the figures, but by evening it is hard to say which decision you made. Have sales gone up or down? Is the rise lasting, or a one-day spike? Which product is carrying you, and which is merely taking up shelf space? For most e-commerce managers the problem is not a lack of reports but the way they read them: the figure is seen but not tied to a question, not compared with the previous period, and in the end does not turn into an action.
In this guide we treat e-commerce reports as a reading habit: we explain step by step which question you ask before opening the report, how to compare periods, what to look at in each sales and order report, and how to turn the difference you find into a decision. We also cover what the Reports section of the Faprika panel shows, along with the headings in the training. For metric definitions and formulas there is the e-commerce metrics article, and for profit calculation details there is the how to prepare a profit and loss report article; here we do not repeat those topics, we show how to connect to them while reading the report. You will also find two small tools on the page: a calculator that compares periods and a checklist for your weekly report routine.
What Are E-Commerce Reports?
E-commerce reports are a compiled and filterable summary of the orders, sold products, customers and payments in your store for a given period. They turn raw records such as order dates, quantities and amounts into a daily, weekly or monthly table; this way you see the overall course of the business without looking at orders one by one.
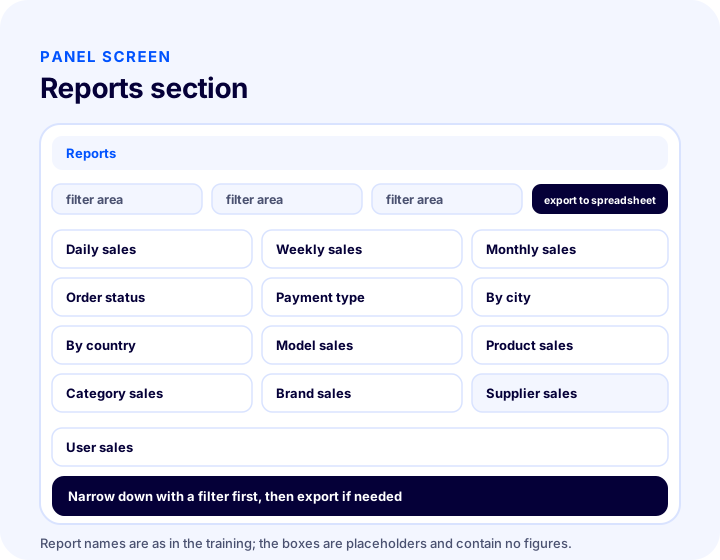
In Faprika, these summaries are in the Reports section of the panel. This section, described in the training content as commercial order reports, covers daily, weekly and monthly sales reports, the order status report, the payment type report, city and country reports, and model, product, category, brand, supplier and user sales reports. Reports can be filtered and exported in spreadsheet format; you can take the data into your own spreadsheet for in-depth analysis.
We recommend readingReports TrainingWhy Are E-Commerce Reports Important?
E-commerce reports matter because figures are the only reliable way to see what works and shift resources there. Intuition works in a small store; as the number of orders, products and campaigns grows, intuition errs, and when it errs the price is paid in stock, advertising budget and time.
Reading reports regularly brings four practical benefits:
- Early warning. Problems such as a growing share of cancellations or returns within a week, or orders from one city drying up, are noticed too late if you wait for the monthly summary.
- Right investment. Knowing which category, brand or product carries sales takes stock and campaign decisions out of guesswork.
- Common language. When marketing, the warehouse and management look at the same report, the discussion runs on figures rather than on "I think".
- Record. Weekly report notes become an archive over time; you can look back at campaign results, seasonal effects and the outcome of decisions taken.
Reading reports is also a matter of time. A short reading done once a week, in the same order and with the same questions, brings far more benefit than a long review done once a month, because the difference is caught while it is still small.
Which Reports Are in the Faprika Panel?
In the Faprika Reports section, each report answers a different question. The table below summarizes the reports described in the training as "what it shows" and "which question it answers". The scope of reports may differ by plan; see the plan pages for details.
| Report | What does it show? | Which question does it answer? |
|---|---|---|
| Daily, weekly, monthly sales | Order dates, order counts and total amounts; in weekly and monthly also product quantity and product total amount | How are sales going over time? |
| Order status | A list of orders filtered by status (for example, completed orders only) | At which stage are my orders, and how many have been completed? |
| Payment type | A breakdown of orders by payment type (for example, credit card only) | How do customers pay? |
| By city and country | The cities and countries your orders come from | Which regions are growing, and which are quiet? |
| Model and product sales | Stock status, sales quantity, total cost, and profit and loss by model code or product | Which product is selling, and which one is earning? |
| Category sales | Sales by product category | Which category carries sales, and which is waiting for promotion? |
| Brand and supplier sales | The sales performance of products by brand and supplier | Which brand or supplier creates more value? |
| User sales | Order count, sales quantity, total cost, total sales amount, and profit and loss by customer | Who do I earn the most from, and how does my customer base behave? |
In addition to these, Faprika’s feature list includes reports such as revenue and net sales, campaign discounts, shipping delivery and returns, and on-site search and SEO. You can see which report is available in which plan in the plan comparison table.
Which Question Are You Asking Before You Open the Report?
The first rule of reading a report is to write down a one-sentence question before opening it. Without a question, your eye goes to the biggest number and the page closes without any conclusion.
Keep the question short and frame it so the answer leads to a decision. For example, “How are sales?” is vague, whereas “How did our orders and average order value change this week compared with last week, and if they changed, why?” tells you directly which reports to look at. A good question has three parts: what am I measuring, what am I comparing it with, and what can I do depending on the result.
A few examples of weekly questions
- Is the change in sales caused by the number of orders or by the average order value?
- Are canceled or incomplete orders piling up?
- Is this week’s best-selling category the same as last week’s?
- Has the distribution of payment types for new orders changed?
- From which city or country have orders stopped or increased?
How Do You Compare Periods?
A period comparison means placing two time spans of equal length side by side and looking at how the same figures changed. A single number says nothing on its own; compared with the previous period, direction and speed emerge.
Compare periods of the same length
Comparing a five-day period with a thirty-day period is meaningless. Compare week with week and month with month. In a weekly comparison, the weight of the days of the week is similar, so effects such as weekend shopping take up the same place on both sides. If the number of days differs between months, give priority to indicators that are not affected by period length, such as average order value.
Take seasonality into account
Sales naturally rise or fall at certain times of the year. That is why comparing with the previous month does not always answer the question “am I growing?” correctly. If possible, also compare the same month with the same month of the previous year; the two comparisons complement each other: one shows the current trend, the other shows growth free of seasonal effects.
Separate campaign days
Discount or campaign days distort the average of normal days. If you compare a campaign week with a non-campaign week, you will see a false “growth.” Read the campaign as a separate period and record its result kampanya yönetimi together with your notes.
Look at three indicators together
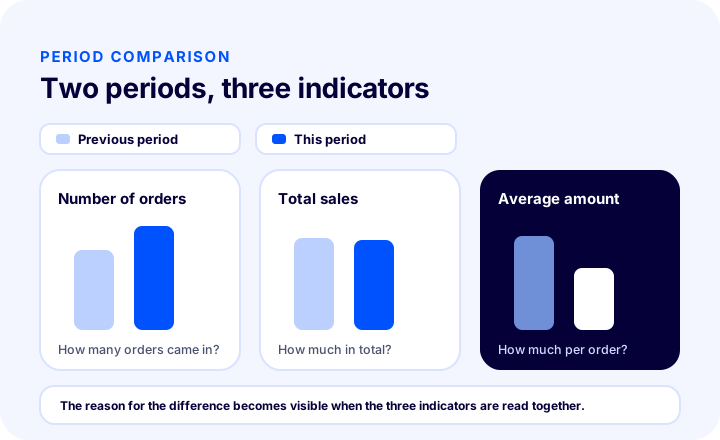
Three indicators are enough in a period comparison: number of orders, total sales amount, and average order value. Average order value is found by dividing total sales by the number of orders. Read together, the three often explain why sales changed: if the number of orders rose but the average value fell, the increase comes from smaller baskets; if the number of orders fell but the average value rose, you are receiving fewer but more valuable orders.
The tool below does this calculation for you. Enter the number of orders and the total sales amount for the two periods; the tool shows the change, the average order value, and a short comment. Simply enter the amounts in your own currency, in the same unit.
Keep two points in mind when using the tool. First, the two periods must be of the same length and scope; if one includes cancellations and the other does not, the difference is false. Second, the tool only answers “what changed”; for the “why” question you need to dig into the reports below.
We recommend readingProfit Margin Calculation: How Is Profit Margin Calculated in E-Commerce?How Do You Read Sales and Order Reports?
When reading sales and order reports, ask every report the same three questions: what changed, why might it have changed, and what can I do. Below is how this question works for each report.
Daily, weekly, and monthly sales report
Sales reports give the general pulse of the business. The daily report is a quick check: was yesterday a normal day? The weekly report is where you do your real reading, because it smooths out daily fluctuations and gathers enough data to make decisions. The monthly report shows direction and growth.
Look at three things while reading: the number of orders, the total order amount, and, in the weekly and monthly reports, the product count and total product amount. The ratio between the number of orders and the product count shows how many products are sold per order on average; if this ratio is falling, baskets are shrinking. In the daily report, a spike or dip on a single day is not enough for a decision; look at the direction over consecutive days.
Order status report
The order status report shows which stage orders are at; in the panel, with the filter in the upper area, you can look at, for example, only completed orders. While the sales report says “how many orders came in,” the status report answers “how many of them actually concluded.” Compare the distribution of completed and other-status orders for two periods; if the share of unconcluded orders is growing, look for the cause on the payment, stock, or shipping side.
Recommended readingHow Do You Manage the Returns Process in E-Commerce?Payment type report
The payment type report separates orders by payment type; for example, you can filter only orders paid by credit card. Watch how the distribution changes over time: if the share of one payment type drops suddenly, it may be a technical problem, or customers may have shifted to another method. This report is a good starting point for reviewing finance and payment settings.
City and country reports
These reports show where orders come from. You see which cities send more orders and which regions offer growth opportunities; the country report feeds your international sales strategy. If you compare two periods and see that orders have stopped in a region, first check the shipping and delivery side, then the advertising and campaigns aimed at that region. A region that keeps growing is a natural candidate for a targeted campaign.
Product, model, and category reports
Product and model sales reports give you which products are selling, how much they are selling, stock status, and total cost and profit and loss information. The critical distinction here is that the best-selling product and the most profitable product do not have to be the same. A product near the top in sales quantity but with a high cost may earn less than a product with a low quantity but a wide margin. For how profit margin is calculated, see profit margin calculation, and to turn the whole report into a profit and loss table, see the profit and loss report article.
The category report offers a broader picture: it shows which categories carry sales and which need promotion. If you see a drop at the category level, drill down into the product report and check whether a single product or the whole category has declined.
Brand and supplier reports
The brand sales report shows which brands are more popular and which struggle to attract attention. The supplier sales report gives a report of products with sales once you add supplier information to your products; it lets you understand which supplier adds more value to your business. These two reports are especially useful before purchasing negotiations and stock planning.
User sales report
The user sales report shows order count, sales quantity, total cost, total sales amount, and profit and loss by customer. Here you see whether sales rely on a few customers or on a broad base. For a customer’s total value over time, you can apply the approach in the customer lifetime value article to this report.
How Do You Set Up a Weekly Report Routine?
A weekly report routine is a reading habit done on the same day and in the same order each week, kept short, and ending with a decision note. The goal is not to read the report perfectly, but to read it every week.
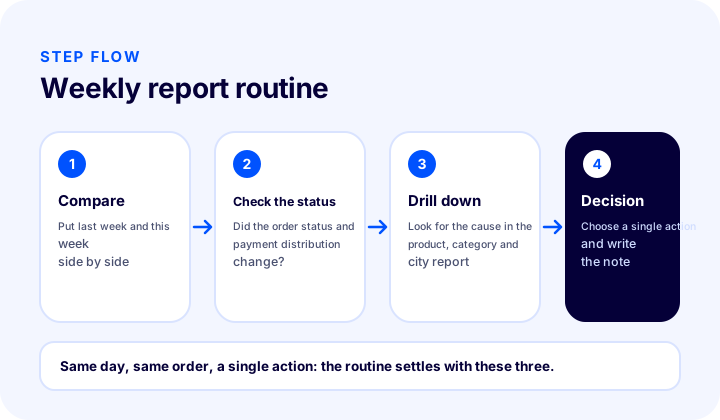
- Compare the period. Put last week and this week side by side in terms of order count, total sales, and average order value.
- Look at order statuses. In the order status report, check the share of unconcluded orders and the payment type distribution.
- Drill down to product and category. Look in the relevant reports for which product, category, brand, or city the difference comes from.
- Write a decision note. Write down what you found and the single action you will take next week.
The duration of the routine varies with the size of the store; for a small store, a short daily check, a medium-length weekly reading, and a deeper monthly review are a reasonable start. The table below is a suggestion and can be adjusted to your own pace.
| Frequency | Which reports? | Purpose |
|---|---|---|
| Daily | Daily sales, order status | Is anything out of the ordinary? Catching problems early |
| Weekly | Weekly sales, payment type, product, category, city | Period comparison and choosing the week’s single action |
| Monthly | Monthly sales, brand, supplier, user sales, profit and loss | Seeing the direction, reviewing the stock and campaign plan |
From Report to Decision: Which Action Does an Observation Turn Into?
The purpose of reading a report is to turn an observation into an action. The table below summarizes common observations, their likely causes, the report to look at, and a sensible first step. The causes are hypotheses; the definitive answer comes from the detail in the reports.
| Observation | Likely cause | Report to look at | First step |
|---|---|---|---|
| Order count rose, average value fell | The share of discounted products grew or small baskets increased | Product and category sales | Plan a basket-building campaign or a complementary product recommendation |
| Sales fell, order count stayed the same | The product mix may have shifted toward cheaper products | Product, model, category sales | Find which products’ share has dropped |
| Unconcluded orders increased | A payment, stock, or delivery problem | Order status, payment type | Look for what these orders have in common |
| Orders stopped from a region | A delivery or campaign problem | By city and country | Check that region’s delivery and advertising settings |
| The best-selling product earns little | Cost is high or the discount is deep | Model and product sales (cost, profit and loss) | Reconsider the price or the discount |
| Sales rely on a few customers | The customer base is narrow | User sales | Plan new customer acquisition and repeat purchase work |
Each row in the table suggests a single action. Instead of choosing five different actions in the same week, do the most important one and read its result in the next week’s report. This is the only way to learn which action works.
The Most Common Mistakes When Reading E-Commerce Reports
The most common mistakes when reading reports are looking at a single number, comparing unequal periods, and not moving from finding to action. Most arise not from the report itself but from the way it is read.
Looking only at total sales
While the total sales amount stays the same, the order count and average value can move in opposite directions. A manager who does not look at these two indicators behind the total notices the problem far too late.
Confusing sales with profit
A best-selling product does not mean a high-earning product. Stock and campaign decisions made without looking at the product, model, and user reports that include cost and profit and loss information can lead you into a trap where revenue grows but profit does not.
Comparing unequal periods
Comparing periods with a different number of days or scope produces a false increase or decrease. Comparisons should always be made with periods of the same length and scope.
Reacting to a single day’s fluctuation
Changing strategy because of one day’s drop is usually unnecessary. Direction becomes meaningful over consecutive days and weeks; leave the decision to the weekly reading.
Not turning the finding into a decision
Reading the report and closing it gives the same result as not reading it. If no decision note is written at the end of each reading, the report becomes nothing more than a habit that starts from zero again the next week.
Examining all the data every week
Looking at every report every week is a waste of time. Choose two or three reports that fit your weekly question; open the others monthly or when needed.
Weekly Report Checklist
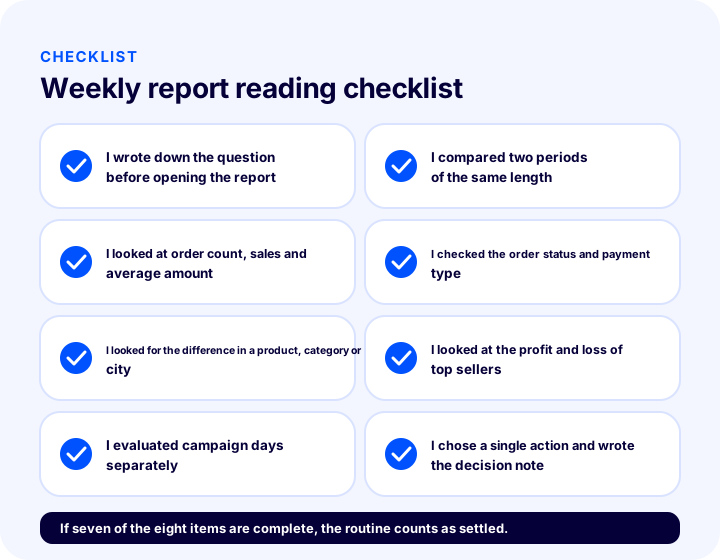
The checklist below strengthens how you read your weekly report. Tick the items; the tool shows how many are done and gives a short comment on the areas still missing.
How Do You Use E-Commerce Reports with Faprika?
Faprika's Reports section turns your sales and order data into daily, weekly and monthly reports, and lets you filter from different angles, from customer behavior to product sales, payment method to city and country. You can also export every report to a spreadsheet for your own analyses.
The routine in this article can be applied directly in the panel: compare the period with the weekly sales report, check order health with the order status and payment type reports, and find the source of the difference with the product, category and city reports. The scope of the reports may vary by plan; to find out which reports you will have in your own plan, you can review our plans or request a demo.
Frequently Asked Questions
What are e-commerce reports?
E-commerce reports are compiled, filterable summaries of a store's orders, products, customers and payments for a given period. In Faprika, these summaries are in the Reports section as daily, weekly and monthly sales reports, plus status, payment type, city, country, product, category, brand, supplier and user reports.
How do you read e-commerce reports?
First write down the question you want to answer, then compare two periods of the same length. Look at order count, total sales and average order value together, look for the reason for the difference in the product, category, payment or city report, and finally choose a single action and take a note.
How often should I read reports?
Look at the daily report as a quick check, at the weekly report as the main reading and decision moment, and at the monthly report to see direction and growth. You can adjust the frequency to the size of your store; what matters is doing it regularly, on the same day and in the same order.
Why is period comparison important?
A single figure on its own gives no information about direction and speed. When two periods of the same length are placed side by side, you can see whether sales rose or fell and whether the rise came from the order count or from the average order value. Evaluating campaign days and seasonal effects separately makes the comparison more accurate.
Is a best-selling product always a product that earns a lot?
No. A product with a high cost or a deep discount can earn little even if it sells a lot. Deciding by units sold without looking at the total cost and profit-loss information in the product, model and user reports can be misleading.
Can I export reports as a spreadsheet?
Yes. As explained in the Faprika training, reports can be exported in spreadsheet format after filtering, so you can take the data into your own sheet and run deeper analyses. Narrowing with a filter first brings in only the rows relevant to your question.
You May Also Like
- E-commerce Metrics: 15 KPIs You Should Track and Their Calculation Formulas
- How to Prepare a Profit and Loss Report in E-Commerce? A Guide to Net Profit by Product
- Profit Margin Calculation: How Is Profit Margin Calculated in E-Commerce?
- What Is Customer Lifetime Value (CLV) and How Is It Calculated?